Performance Debugging Leads to Discovery of a Bizarre Browser Bug
I worked on an interesting performance investigation recently, and I wanted to share some of the techniques I used to dig in and isolate the problem.
It all started when a customer informed me that they rolled back an HTTP/2 configuration push because it caused significant slowdowns on their site. And by significant they meant a greater than one minute delay in render time!
As with many performance troubleshooting efforts, I started with WebPageTest to get an idea of what was causing the delays. I then dug deeper with a variety of additional tools and techniques. This particular issue turned out to be caused by a really interesting bug in the Chrome browser, which was recently patched.
The bug affected only a handful of sites on Chrome browsers older than v59. When the specific conditions that triggered this behavior occurred, the waterfall graph looked like the below image (we blurred the details to protect the client). Fortunately this only happened to a few sites, but the ones impacted had to disable HTTP/2 until Chrome 59 was released on June 6th, 2017.

Collecting Diagnostic Data
When we first talked with the customer about this, they explained the issue they saw but none of us at Akamai could reproduce it. I started asking whether there were proxies in their network that could be impacting the traffic. However the issue was occurring both inside and outside their network – and only with browsers that had no existing cache.
We attempted to troubleshoot this in real time and collect diagnostic data. We had scheduled a one hour time where we could enable H2 in production, collect diagnostic data, and quickly roll back the configuration once we had enough information to analyze this further. We collected the following:
- Akamai logs from the edge servers
- CatchPoint test results from multiple locations
- WebPageTest results with packet captures from multiple locations
- SiteSpeed.io tests run by the customer
- HAR files exported from browsers that were able to reproduce the issue
- HTTP/2 Debug Log (from chrome://net-internals/#http2) from browsers that were able to reproduce the issue
Checking the Logs
Despite all the monitoring, we were only able to reproduce the issue on a handful of machines: the customer’s laptop, a few CatchPoint agents, and a few WebPageTest agents. It only happened on Chrome browsers, too.
The first thing I did was attempt to pull logs and see if we could identify the issue there. Akamai Pragma headers were used to give us the necessary information to track down the logs, and I was able to quickly pull up logs from an impacted client’s requests to Akamai. I saw lots of requests that were responded to in under one second – but nothing that looked anywhere close to 70 seconds. So this told us that either the issue was not being logged, or that it was occurring before an HTTP request was made to Akamai.
Analyzing the Chrome HTTP/2 Debug Trace
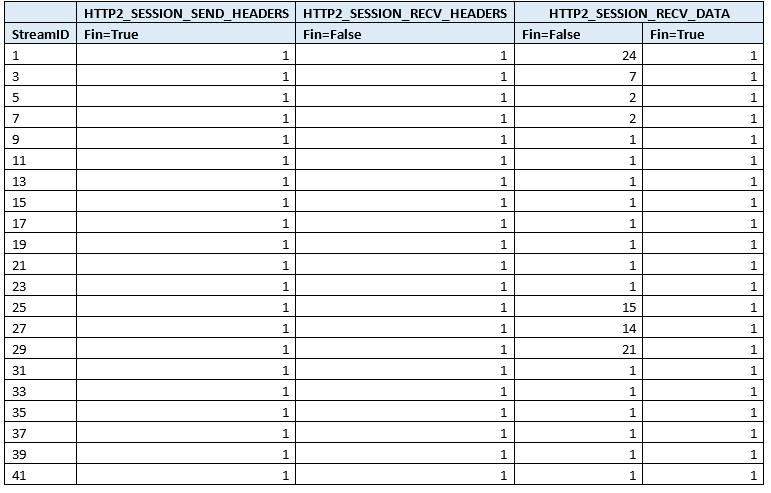
Next we examined the HTTP/2 Debug log. These log files can be a bit difficult to follow, so I used a tool that I wrote for parsing data out of these files and created a CSV extract. I filtered on the event name HTTP2_SESSION_SEND_HEADERS and could see multiple HTTP/2 requests for a coalesced domain.

However when I looked at the stream_id column, I was able to correlate each request with a “fin” data frame . That confirmed that every HTTP2 request that was made, was responded to. Since we know that the HTTP/2 requests were served quickly at the edge (from the Akamai logs we examined), and there weren’t any requests that weren’t responded to – that means that the browser never actually made the request.

Looking at the end of the events in the HTTP/2 debug log I can see stream-id 41 complete and then the connection closed 70 seconds later:

And the debug log indicated that the error was because the connection was closed:
t=37328 [st= 382] HTTP2_STREAM_UPDATE_RECV_WINDOW
    --> delta = 914
    --> window_size = 15728640
t=107321 [st=70375] HTTP2_SESSION_CLOSE
    --> description = "Connection closed"
    --> net_error = -100 (ERR_CONNECTION_CLOSED)
t=107321 [st=70375] HTTP2_SESSION_POOL_REMOVE_SESSION
    --> source_dependency = 1465 (HTTP2_SESSION)
t=107321 [st=70375] -HTTP2_SESSION
Analyzing a Packet Capture
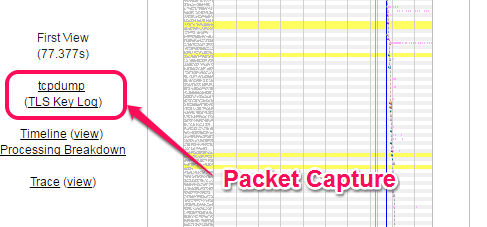
Next I decided to analyze the TCP packet capture from a test run where the issue occurred. On the WebPageTest instance where I was able to reproduce the issue, I ran a test with the advanced setting: “capture network packet trace”. Once the test was run, I downloaded the tcpdump capture.

The packet capture clearly shows that the site negotiated a H2 connection via ALPN…

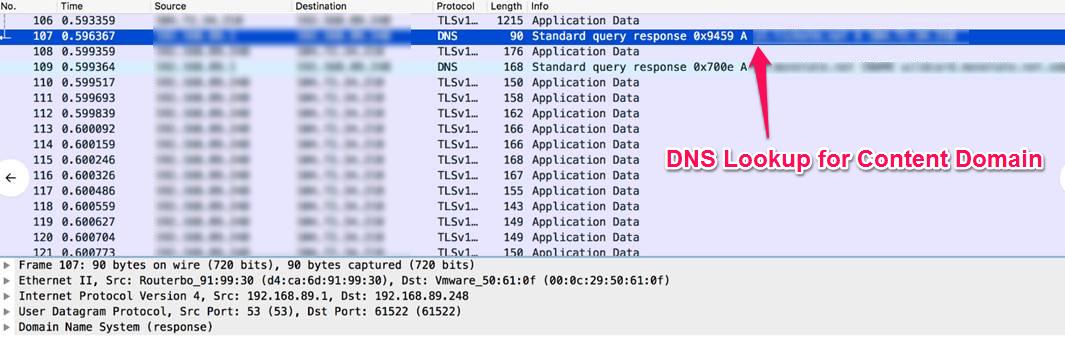
…and that one of the content domains resolved to the same IP address.
Instead of opening a new TCP connection, this second domain coalesced to the existing H2 connection, which was expected.

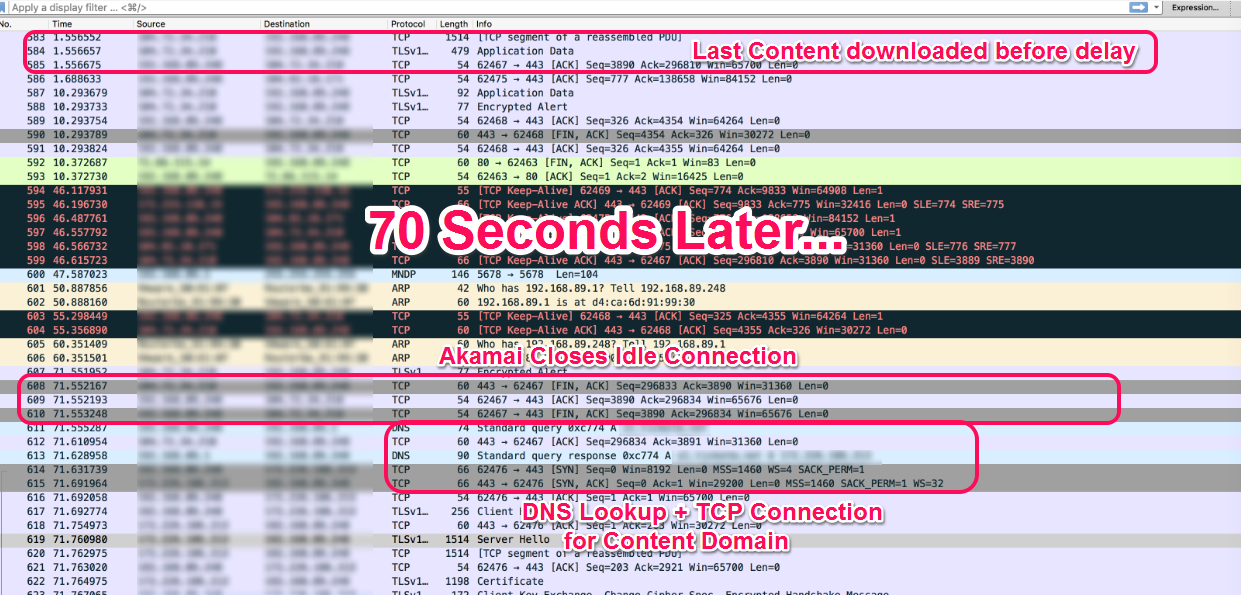
After 1.6 seconds we see a drop in network activity. Then there is no activity for a while, until some TCP Keep-Alive ACKs at ~46s. At around 71s, the edge server sent a FIN packet and closes the connection.
At this time the browser attempted to perform a DNS lookup, and resolved to a different IP address. When it attempted to establish a connection, ALPN indicated that it would only support HTTP/1.1 (H2 was not enabled on the content domain at the time of testing). At that point the client was able to request and receive responses via HTTP/1.1, but after a very severely impacted experience.

We also saw the same issue occur in CatchPoint, although the test was terminated after 30 seconds. This helped us confirm that there wasn’t an issue with WebPageTest – since it occurred across multiple measurement tools.

At this point, we knew that Akamai wasn’t seeing the requests, the browser wasn’t issuing the requests, and this was occurring across multiple Chrome browsers and measurement tools. It was really looking like a bug in the Chrome browser. However I wasn’t really sure how to prove that.
Digging Into Chromium
The next step in troubleshooting was to work with someone that knew both Akamai’s HTTP/2 implementation as well as Chrome’s HTTP/2 implementation. Fortunately I knew the right person within Akamai to ask: Yoav Weiss, a Principal Architect on Akamai’s Web Experience Engineering team. In addition to helping architect many of the latest and greatest Ion features, he is also a developer on the Google Chromium project and helps contribute important performance features to the browser.
When I asked Yoav about this, he started looking at deep diagnostic data within the Chrome browser and was able to theorize what might be occurring. After some more troubleshooting, he was able modify a development build of Chrome to further analyze and try to isolate where the issue was occurring. He also found another non-production Akamai site that was affected by the same issue, and was able to analyze that one as well.
After an extremely thorough debugging session, Yoav discovered that under some circumstances, outgoing requests tried to open new sockets before reusing the existing HTTP/2 connection. Once the 6 sockets limit is reached they were added to the “pending requests” container, which wasn’t properly drained and left a few of them in there. In a sense, Chrome’s network stack “forgot” about those requests until the HTTP/2 connection timed out.
The Chromium Bug Report
While we were conducting our analysis another Akamai customer had reached out Google to report the same behavior. And then a WebPageTest user had reported a similar issue on www.bosslaser.com, which is not using a CDN. Google’s Patrick Meenan (the author of WebPageTest as well as a Chrome developer) filed a Chrome bug report as well, and you can see the bug report and discussion here.
This additional information proved both that the issue was more widespread, although still very uncommon. It also confirmed that this was not specifically an Akamai issue since it was occurring on non-Akamaized sites as well.
The bug report and analysis validated much of the analysis we had done up until then, and more importantly one of the Chromium engineers on Google’s Net team, Matt Menke, was able to isolate the cause of the issue and fix it within a day of reporting. His work also confirmed that this is a relatively obscure issue within the socket pool code in Chrome, and that it would have rarely been triggered.
Conclusion
It turned out that the issue we were investigating was not due to a customer’s implementation, but due to a pretty serious browser bug was identified and patched very quickly. Since it was browser bug, we had to wait for a browser release before proceeding with this customer’s HTTP/2 work.
The issue seemed to occur rarely, and we’ve only seen it on a handful of sites. We believe that the issue was also limited to cases where the HTTP/2 connections are coalesced. Chrome v59 was released on June 6th, 2017 and according to https://bugs.chromium.org/p/chromium/issues/detail?id=723748#c36 the fix was confirmed to be included in Chrome v59.
It’s always fascinating to see how even the most obscure technical issues are discovered and corrected in real time by the open source community, making software better for everyone.
Special thanks to Yoav Weiss (Akamai), Patrick Meenan (Google) and Matt Menke (Google) for their amazing work on digging into this issue and resolving it so quickly.
Originally published at https://developer.akamai.com/blog/2017/06/27/performance-debugging-leads-discovery-bizarre-browser-bug/
